What data does this site collect?
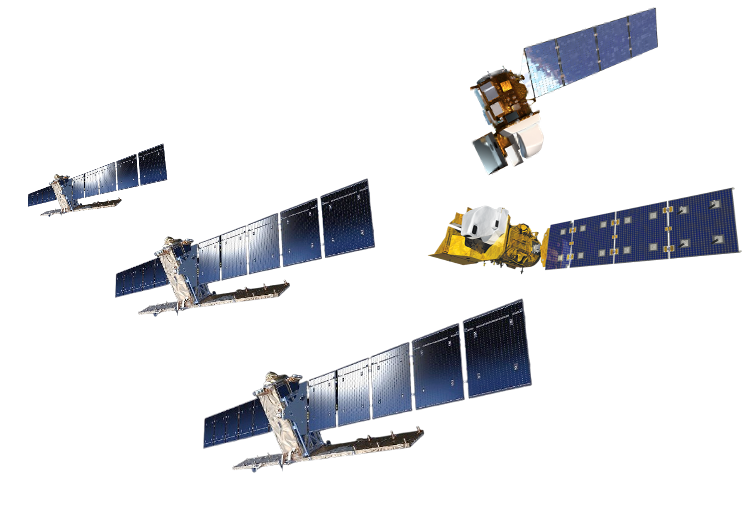
This is the data portal of the NASA–GIST Core Validation Site (CVS) at Hampyeong, South Korea — a heavily instrumented 1 km × 1 km cell used to check ("validate") the soil-moisture maps produced by satellites such as NASA SMAP and NASA-ISRO NISAR. To do that, we measure the same field in four independent ways — from the ground, from drones, from satellites, and with reference base maps — and put them all on one interactive map so they can be compared date by date.
1. The site
The core cell is a real EASE-Grid 2.0 1-km cell (center 35.0151°N, 126.5508°E), nested inside the matching 3 km, 9 km and 36 km satellite grid cells — you can see all four drawn on the map in the In-situ tab. Within this one square kilometre the site spans six land-cover types: rice paddy, upland field, deciduous / coniferous / mixed forest, and grassland, so one cell exercises a satellite algorithm across very different surfaces.
2. In-situ sensor network — the ground truth
47 stations, 82 soil sensors (METER TEROS-12), logging soil moisture and soil temperature every 5 minutes, continuously since June 2025. Sensor placement follows the land cover:
- Rice paddy — one sensor in the irrigated zone (10 cm depth) and one in the paddy bank (20 cm)
- Upland field / grassland — one sensor at 10 cm
- Forest — one sensor in the tree-root zone (10 cm) plus one on the tree trunk (~1 m above ground, measuring stem moisture)
Data are quality-flagged and distributed in the ISMN (International Soil Moisture Network) standard format. The charts on this site use hourly means; the full 5-minute records are available on request. Stations whose newest reading is less than 30 days old pulse with a red ring on the map.
2b. Soil properties — measured, not estimated
A soil-moisture sensor reading only means something if you know the soil it sits in, so we dig a soil core at the station and send it to the laboratory. For each sampled spot the lab reports:
- Particle size — sand / silt / clay fractions (%), and the resulting USDA texture class (e.g. silt loam, loam)
- Carbon — organic carbon, total carbon, and organic matter (%)
Samples are taken at the same depths as the sensors — 10 cm in the irrigated zone and 20 cm in the paddy bank — so the soil description matches the measurement. These are real laboratory values, and they matter: at Hampyeong the measured organic carbon comes out several times higher than the national-database estimate, which is exactly the kind of difference that shifts a soil-moisture retrieval.
Sampling is still in progress — only some stations have been cored so far. Those stations pulse with a blue ring on the map, and their info panel shows the numbers with a “lab-measured” badge. Stations not yet sampled fall back to the Korean Soil Information System (a national database estimate) and are labelled “database estimate”, so the two are never mixed up. Measured values are published as ISMN static variables.
3. UAV (drone) campaigns
Roughly every 1–2 weeks in season we fly the full cell and deliver everything at 1 m resolution:
- Multispectral camera — blue / green / red / near-infrared bands plus a thermal (LWIR) channel, from which we produce true-color RGB, vegetation index NDVI, water index NDWI, and surface-temperature TIR maps
- LiDAR — a digital surface model (DSM) of terrain and canopy height
- PolRA L-band radiometer — the same measurement principle as SMAP, flown at drone altitude: V/H-pol brightness temperature and a retrieved soil-moisture map
4. Satellites
For every family of satellite data we archive scenes clipped to the site, so ground / drone / satellite views can be flipped through on the same dates:
| Product | What it shows | Resolution | Revisit |
|---|---|---|---|
| HLS NDVI (Landsat 8/9 + Sentinel-2) | vegetation greenness | 30 m | 2–3 days |
| Landsat 8/9 LST | land-surface temperature | 30 m | ~8 days |
| MODIS NDVI | vegetation greenness | 500 m | 16-day composite |
| MODIS LST | land-surface temperature | 1 km | 8-day composite |
| Sentinel-1 VV / VH | C-band radar backscatter — sensitive to soil moisture (VV) and vegetation (VH) | 10 m | ~6 days |
| NISAR (beta) | L-band radar: soil-moisture retrievals, HH/HV backscatter, incidence angle | 200 m | site is a validation node |
5. Reference base maps
Static layers used to interpret everything else: a 5-m land-use / land-cover map, a 0.5-m DEM of the site, and a 30-m regional DEM.
6. How the data flows
Field loggers → lab NAS at GIST → standardization scripts (ISMN formatting, quality flags, resampling to the site grid) → this portal. The site is fully static — every layer you see is a pre-rendered, georeferenced image, which keeps it fast and archivable. Updates land roughly weekly.
7. Getting the data
Browsing is free and unrestricted. Downloadable files (station CSVs, raw NetCDF/GeoTIFF) are provided by email request — this lets us track usage, support users properly, and report impact to the funding agencies. Use the request buttons in the In-situ tab, or write to hyunglokkim@gmail.com with your name, affiliation, intended use, variables and time range.
Operated by the HydroAI Lab, GIST in partnership with NASA JPL and NASA GSFC. If you use these data in a publication, please contact us for the correct citation.